
Forex Trading 101: Study How To Analyze Charts
Understanding the movement of currency prices is a crucial skill to learn in forex trading. New traders quickly discover that most trading decisions depend on reading charts. Developing financial decision-making skills starts by reading the market movements and identifying profitable trends through analyzing charts in forex trading.
Chart analysis
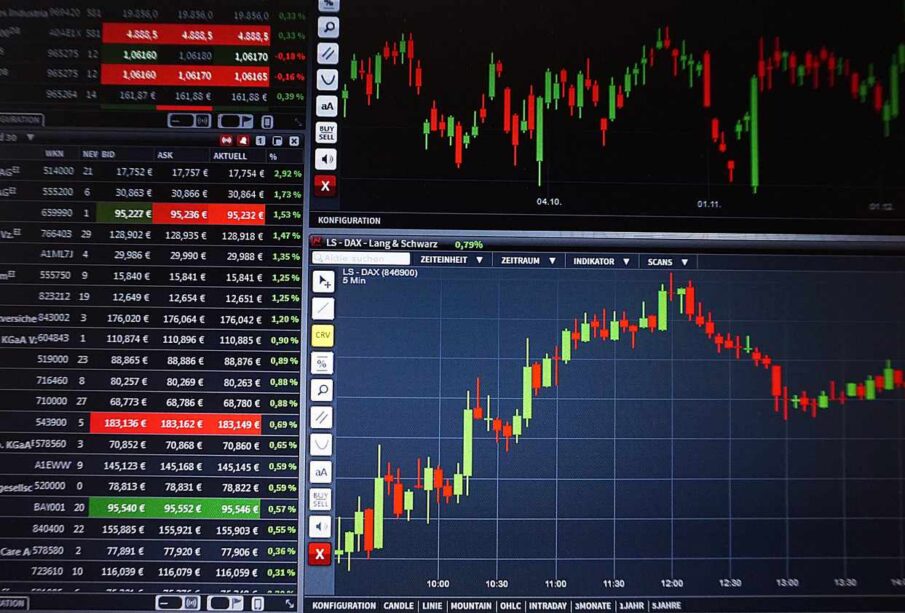
Forex charts show the history of price movements over a period. You will see the patterns in the market, such as:
- going up
- going down
- staying the same
You can predict price changes when you understand the patterns. You can choose better moments to buy or sell the currency pair.
Chart analysis helps you avoid guessing. Many traders lose money because they depend on:
- emotions
- random decisions
The decision becomes more logical when using the charts. You can rely on:
- signals
- trends
Your trading becomes more stable and professional.
Types of forex charts
You must know the basic types of charts to analyze:
Line chart
A line chart is the simplest type, which connects price points with a straight line. You can see the overall direction of the market without showing detailed information.
Bar chart
A bar chart shows the following:
- opening
- closing
- high
- low prices
The details give you a clearer view of price behavior.
Candlestick chart
The candlestick chart is the most popular chart among traders. It is easy to read and shows strong visual information. Each “candle” tells you the following details:
- open
- close
- high
- low prices
Candles can show patterns that signal trend reversals or price continuation.
How does chart analysis give you an advantage?
Having skills in chart analysis gives you many benefits.
You spot trends early!
You can identify long-term and short-term trends. You can trade with the trend when you know the direction. It increases your chances of profit.
You avoid risky market conditions
Charts can warn you when the market if:
- too volatile
- unpredictable
You can avoid trades that may result in losses.
You improve your timing
Chart analysis teaches you when to enter and exit the market. Good timing is one of the keys to successful forex trading.
You make wise financial decisions
You rely on patterns and signals rather than reacting to sudden market movements. It makes your trading more disciplined and organized.
Important chart tools to learn
The chart tools are used as a guide in trading FX. You will be guided and informed about how FX trading should work. Here are the chart tools in FX that you must learn.
Support and resistance levels
These are lines on the chart that show the updates of the price, such as:
- stops
- changes direction
You can plan with your trades better by knowing the support and resistance levels.
Moving averages
The tool helps to smooth out the price movements. The average price is displayed over a period and helps you see trends more clearly.
Trendlines
The lines connect important price points. It helps you identify the market direction. Trendlines show if the market is:
- moving upward
- downward
- sideways
Indicators
Many traders use indicators, such as:
- RSI
- MACD
The tools will provide extra confirmation before making a trade.
Practice is the key to mastering chart analysis
Learning chart analysis needs to be practiced. You can start by observing charts daily by identifying:
- trends
- possible price patterns
Your eyes become more trained, and your understanding becomes stronger. You do not need to be perfect, but only need to be consistent.
Conclusion
Chart analysis is one of the strongest tools a forex trader can have. It helps you understand market behavior to protect your finances. You gain more confidence and control over your trading journey when you master charts. You can use chart analysis to support your success in the world of forex trading with the right knowledge and consistent practice.


-
5 Signs Your Business Has Outgrown DIY Bookkeeping (And What to Do Next)
Most small business owners start out managing their own books out of ... -
-
-
-